To grow on social media, as an individual or a business, it is necessary to keep track of the statistics and trends for different social media platforms. They tend to keep changing frequently, and it might become difficult to keep track of them more often.
So here we have compiled 35+ social media marketing statistics & trends for you to consider.
Key Social Media Marketing Statistics
Social Media Usage Statistics
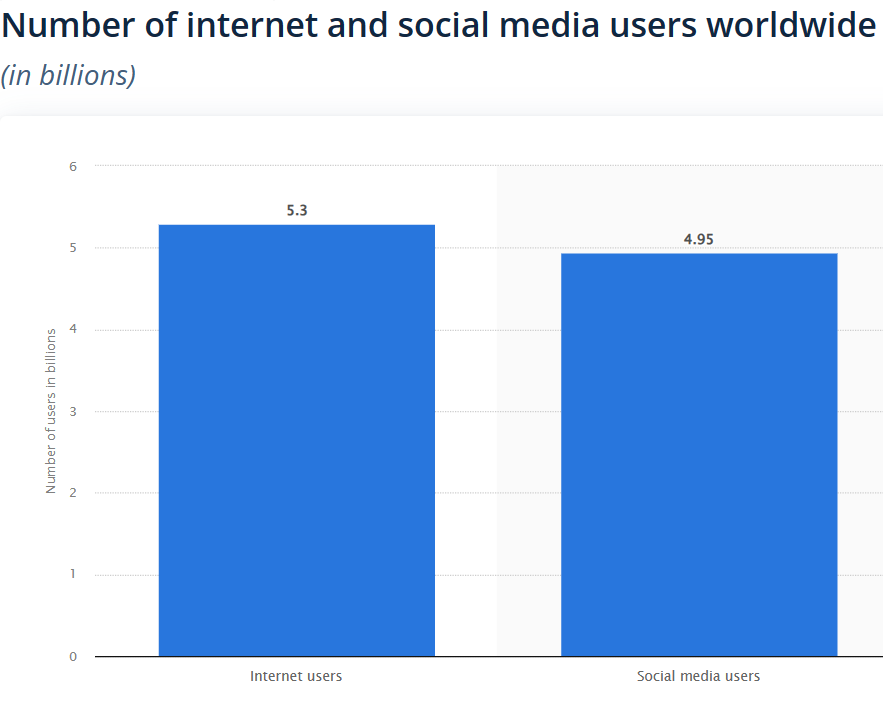
- More than 60% (61.4%) of the world’s population, i.e., 4.95 billion people, are active social media users globally. Source: Statista
Source: Statista
- In the US, 68.5 million social media users are millennials, people who belong to the age group of 27 to 42, and 56.4 million users are Gen Z, people who belong to the age group of 11 to 26. The number, combined for millennials and Gen Z, is set to reach 135.5 million by 2027. Source: eMarketer
- The number of social media users increased by almost three per cent in a decade between January 2013 and January 2023. It went to 4.76 billion in January 2023. Source: Datareportal
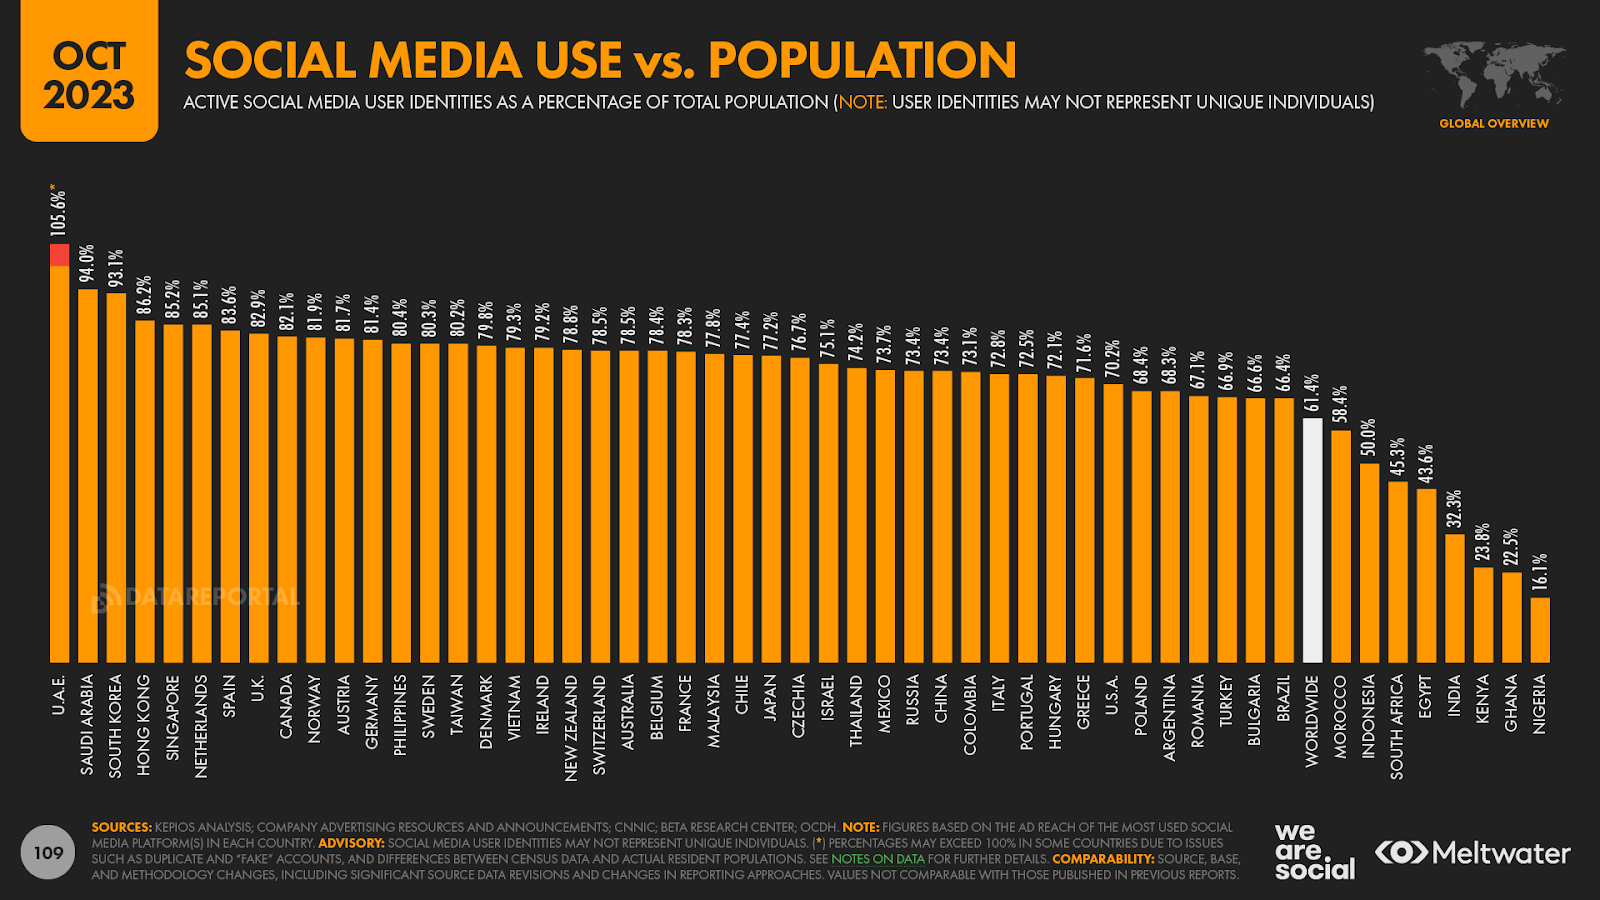
- In the UAE, active social media users make up 105.6% of the total population, the highest in the world, whereas only 32.3% of the total population are active social media users in India. Source: Datareportal
Source: Datareportal
- On average, a person uses 6.7 different social media channels. The number even increases to 7.5 social media platforms among the audience in the age range of 18-24. In Japan, a person uses only 3.5 social media platforms, which is the lowest, while in Brazil, it is the highest at 8.1. Source: Datareportal
Social Media Platforms Statistics
- Facebook Statistics
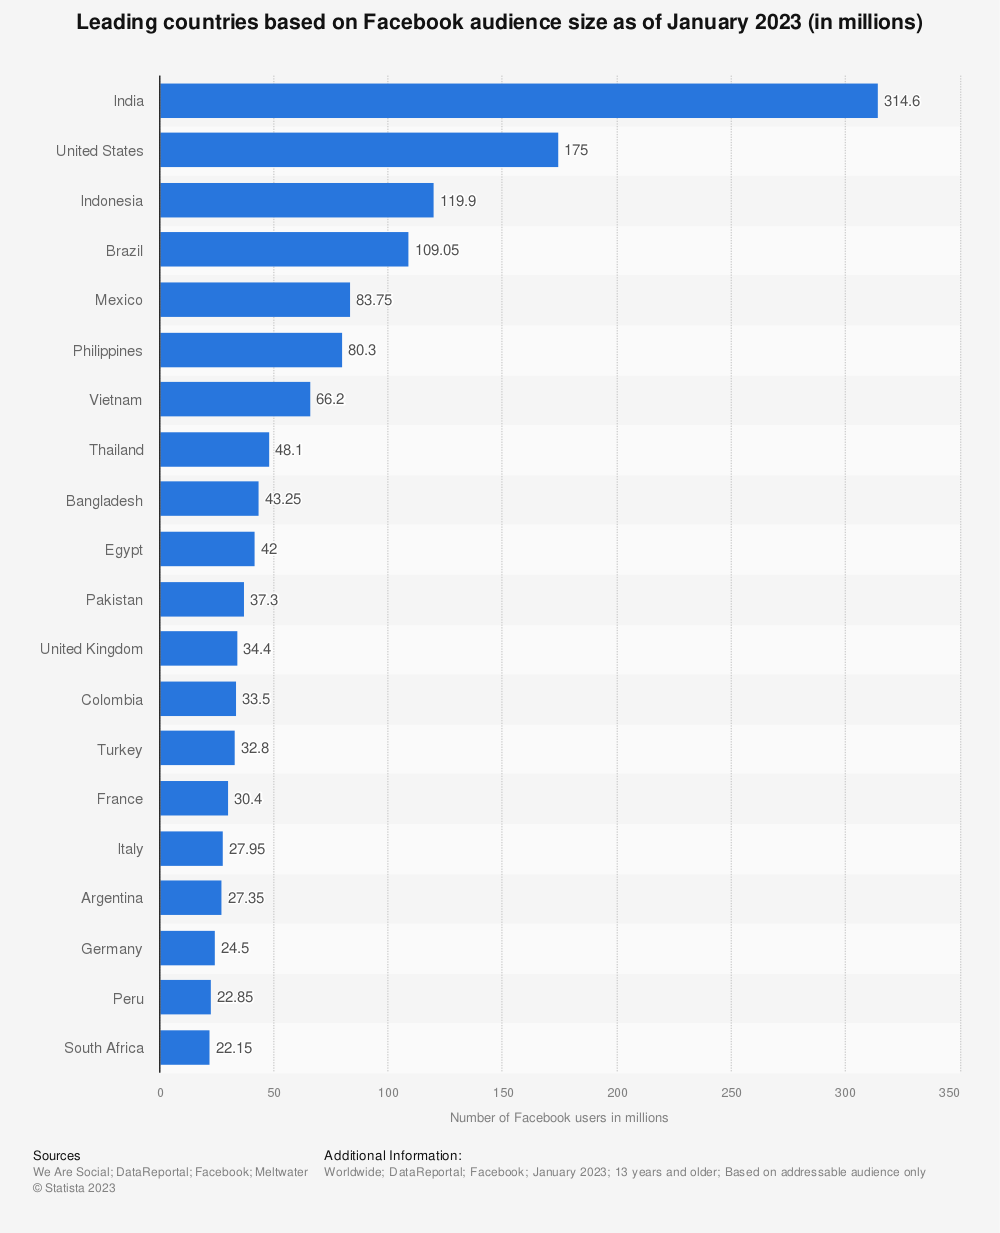
- In 2023, India stood with the highest number of Facebook users at 314.6 million globally. The US has the 2nd highest number of Facebook users, followed by Indonesia at 175 million and 119.9 million, respectively. Source: Statista
Source: Statista
- After Google and YouTube, Facebook is the 3rd website with the most views. Source: Statista
- Facebook is also the 3rd app, after TikTok and YouTube, that is most used based on total usage time. Source: Statista
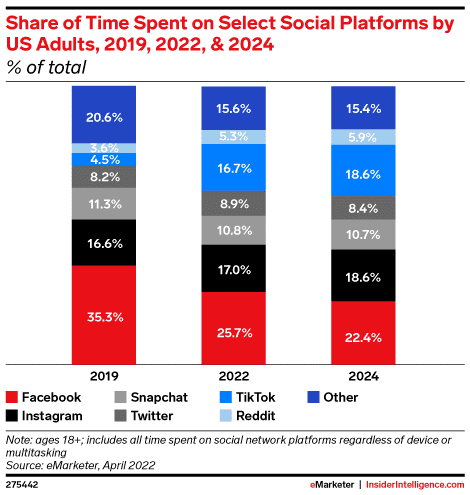
- In the US, Facebook adult users spend almost 22.4% of their time on the platform. On the other hand, 18.6% of their total time is spent on Instagram. Most of their time is spent on Facebook, whereas the least is spent on Reddit. Source: eMarketer
Source: eMarketer
- A total of 2.08 billion people use Facebook daily. It accounts for 3.7 million of Facebook’s monthly users. Source: Statista
Source: Statista
- The most followed top 3 pages on Facebook are Facebook, Cristiano Ronaldo, and Samsung. Source: Wikipedia
- Instagram Statistics
- In 2023, India also had the highest number of Instagram users, at 229.55 million in the world. The US has the 2nd highest number of Instagram users, followed by Brazil, with 143.35 million and 113.5 million, respectively. Source: Statista
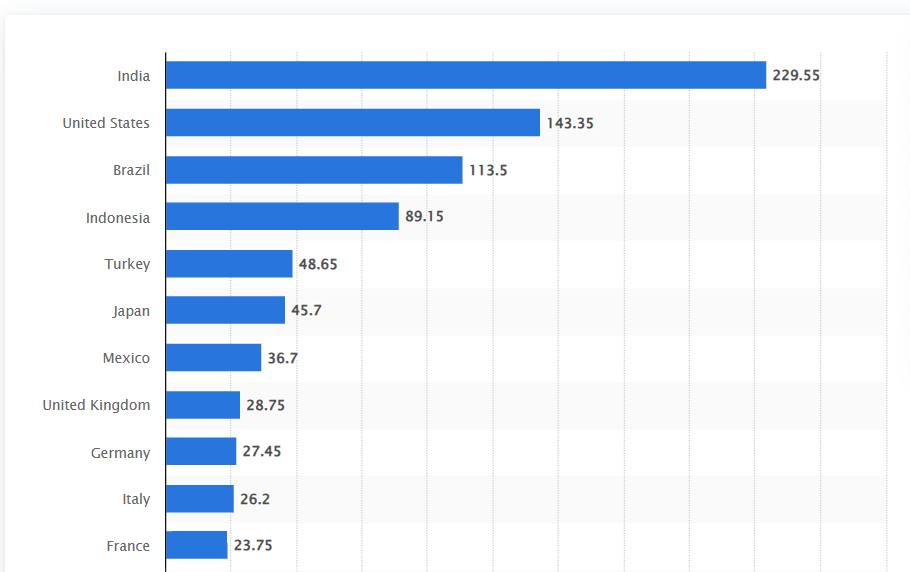
Source: Statista
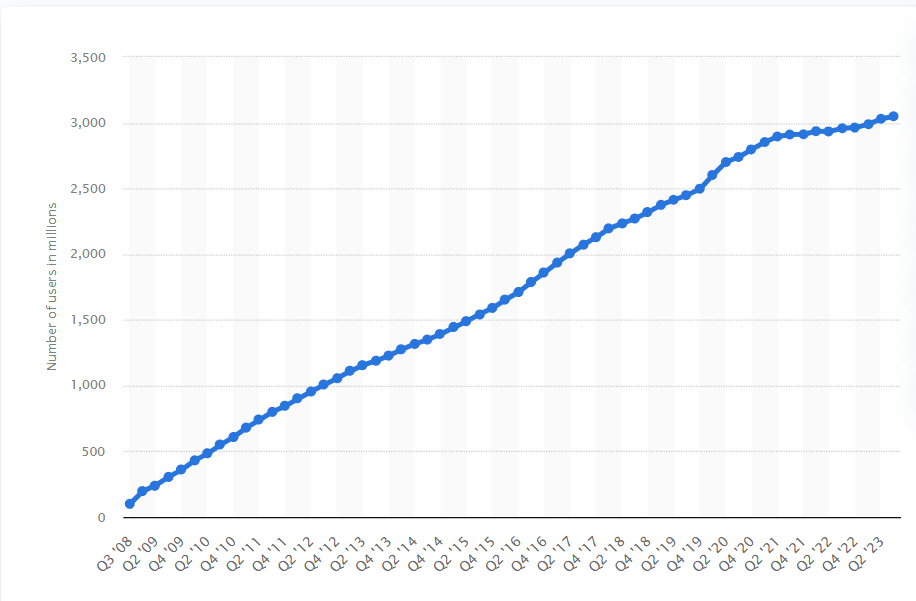
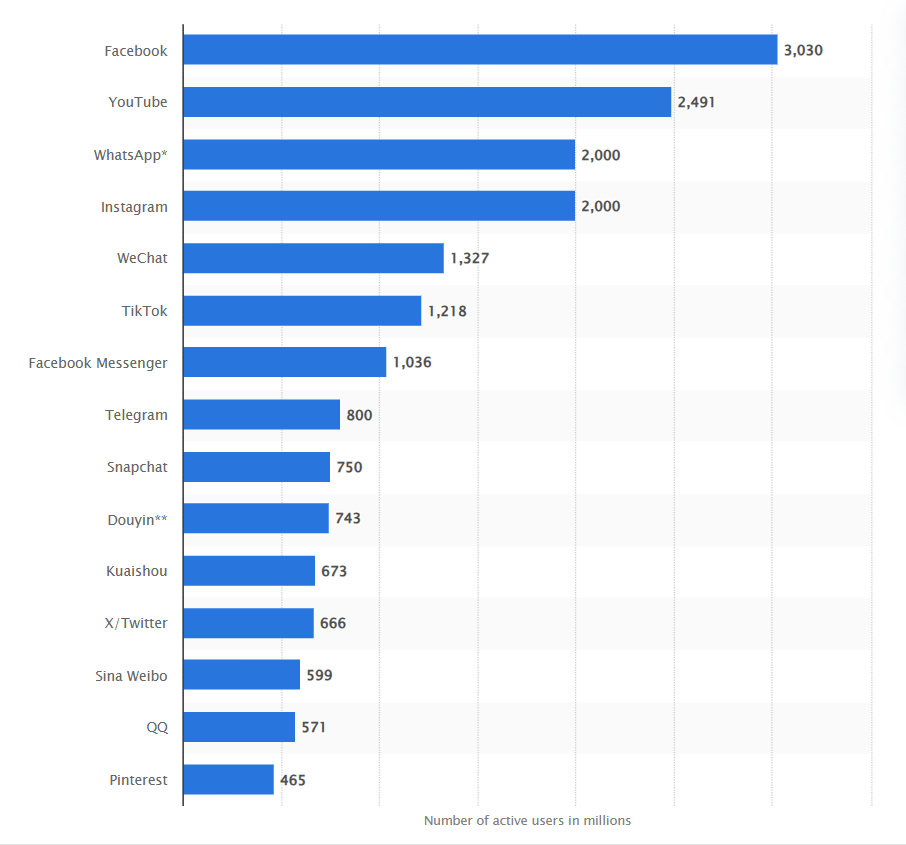
- Instagram is the 4th most-used social media platform after Facebook, YouTube, and WhatsApp, with 2000 million active users globally. Source: Statista
- #love is the most used hashtag on Instagram, with over 2 billion tagged posts, followed by #instagood, which has 1.6 million tagged posts. Source: InfluencerMarketingHub
- More than 80% of Instagram users are under the age of 45, and only 2.6% of Instagram users are over 65 years of age. Source: Statista
- As per the recent data, carousel posts have the highest engagement on Instagram (3.11%), followed by images (2.76%) and videos (2.60%). Source: Later
- Instagram users with an Android system spend an average of 51 minutes per day on the platform. Source: Datareportal
- LinkedIn Statistics
- LinkedIn has more than 1 billion users, which it achieved for the 1st time in 2023. The highest number of LinkedIn users is in the US (211 million), followed by India (117 million) and Brazil (70 million). Source: LinkedIn
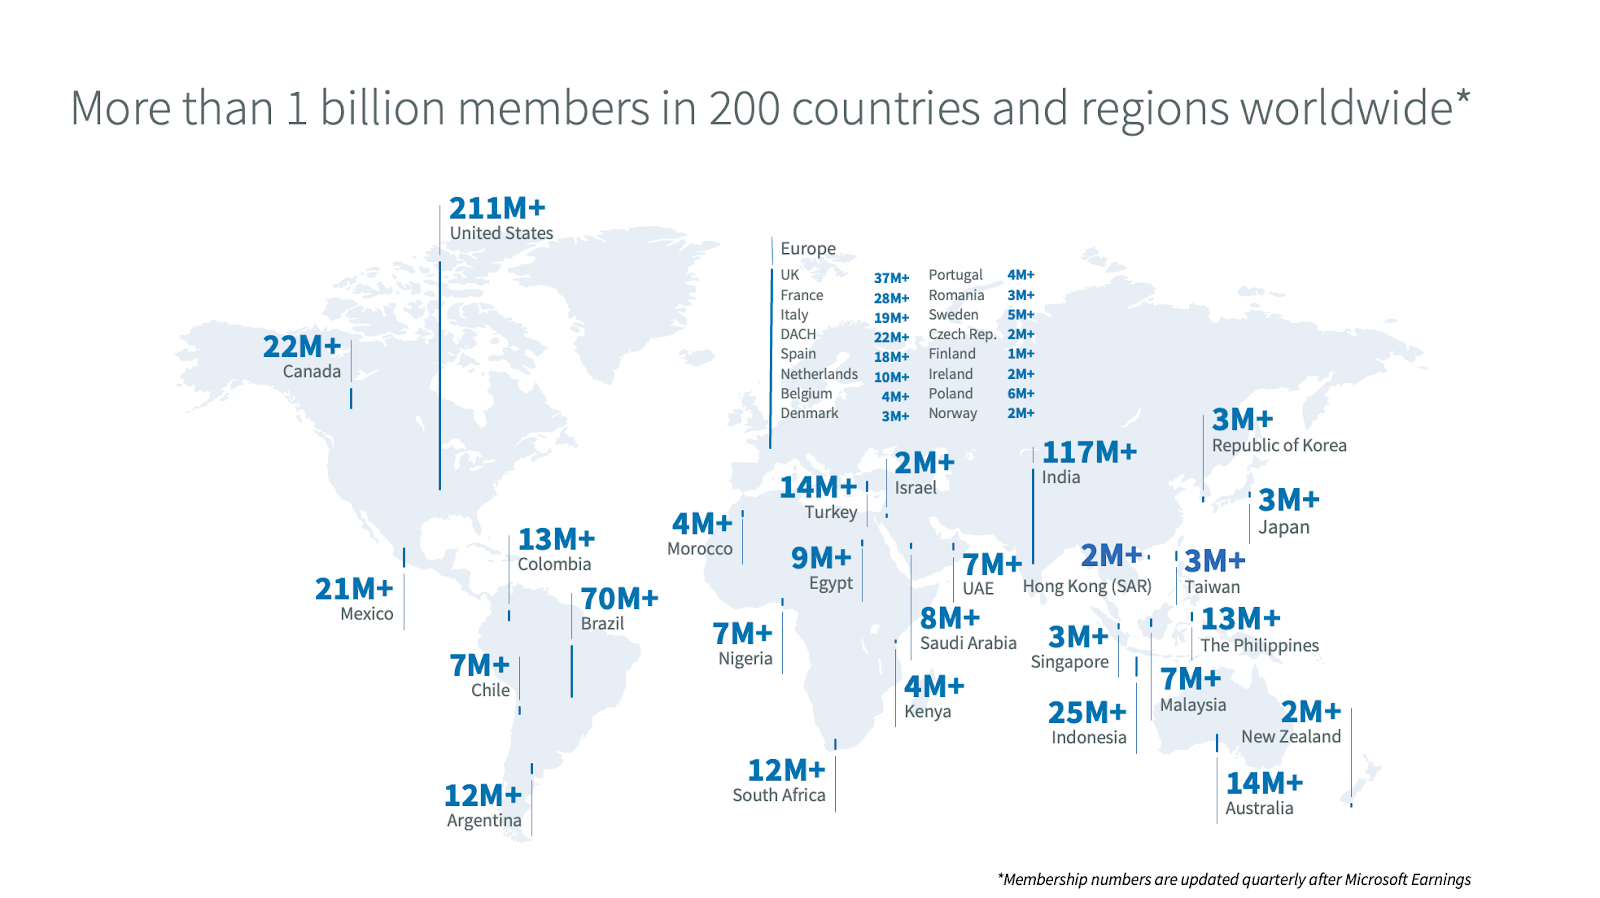
Source: LinkedIn
- 140 jobs are submitted every second, and six people get hired every minute on LinkedIn. Source: LinkedIn
- 60% of LinkedIn users are in the age bracket of 25 to 34, whereas only 2.9% of LinkedIn users are above 55 years of age. Source: Statista
- The revenue of LinkedIn crossed 15 billion dollars for the very first time in 2023. Source: LinkedIn
- The revenue from the LinkedIn premium account was 6.44 billion dollars in 2023. It is 0.7 billion dollars more than in 2022, which was 5.7 billion dollars. Source: Statista
- TikTok Statistics
- TikTok is the only social media site with an almost equal gender user base. 49.2% of TikTok users are female, and the rest, 50.8%, are male. Source: Statista
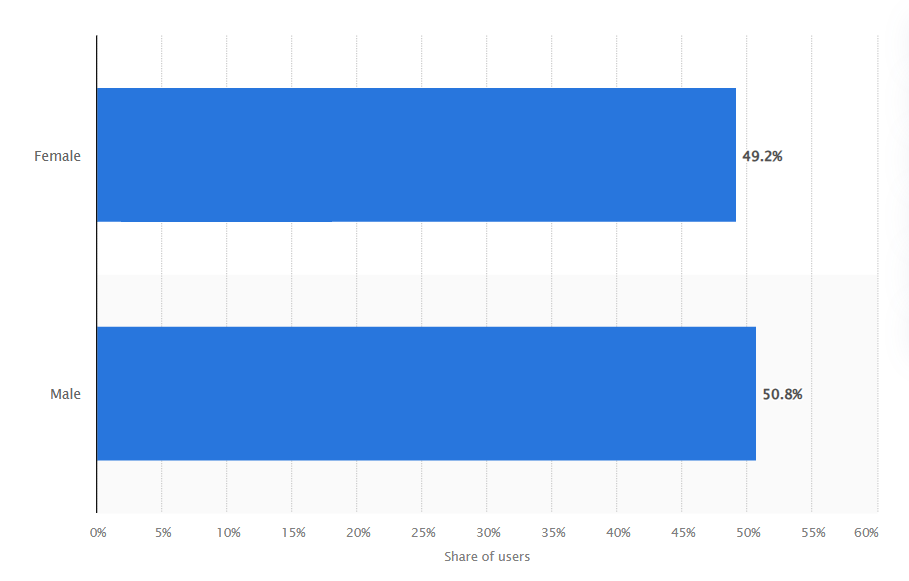
Source: Statista
- Almost 70% of the TikTok user base is under the age of 35. 36.2% of total users are in the age bracket of 18-24, whereas only 6.4% are above 55. Source: Oberlo
- TikTok became the 1st app to spend over 1 billion dollars in consumer spending in a quarter in 2023. It is followed by Honor of Kings and YouTube, with consumer spending of 570 million dollars and 530 million dollars, respectively. Source: Businessofapps
- TikTok is the only non-gaming app that generates most of its revenue from one-time purchases. The other social media platforms generate their maximum revenue (up to 70%) from subscription spending. Source: Businessofapps
- TikTok also has the highest time spent by its users among all the other social media platforms. On average, a TikTok user spends 95 minutes daily on the platform. Source: Statista
- YouTube Statistics
- Forecasts between 2024 and 2028 indicate that there will be a steady increase in the global number of YouTube users, adding 263 million users (or 30.29 percent) to the database. The number of users on YouTube is predicted to reach 1.1 billion in 2028. Source: Statista
- One billion hours of videos are watched on YouTube every day, and more than 500 hours of content are uploaded on it every day. Source: Statista
- Only 0.9% of YouTube users are unique users; the rest are also active on one or more social media platforms. Source: Hootsuite
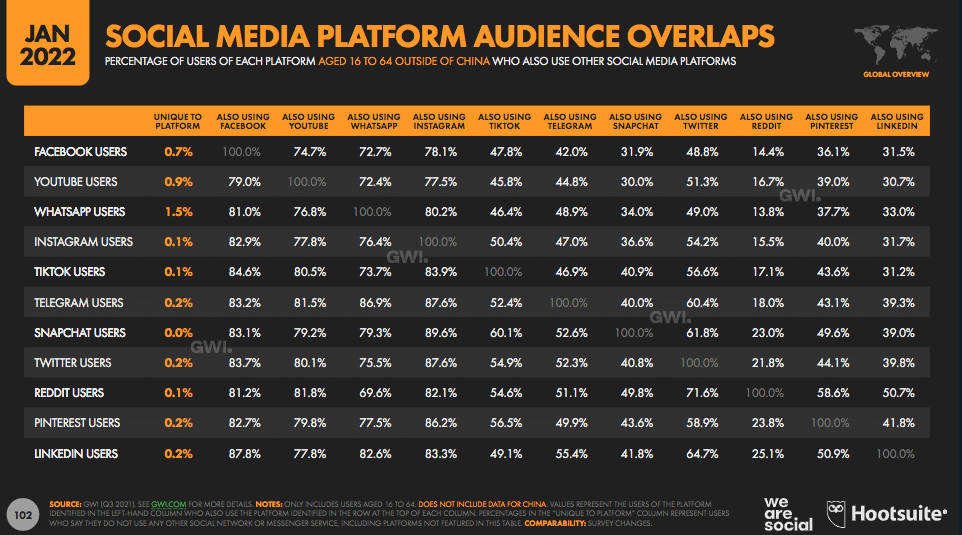
Source: Hootsuite
- Over 14 billion YouTube users visit the website every month, making it the 2nd most visited website in the world, only after its parent company, Google. Source: Hootsuite
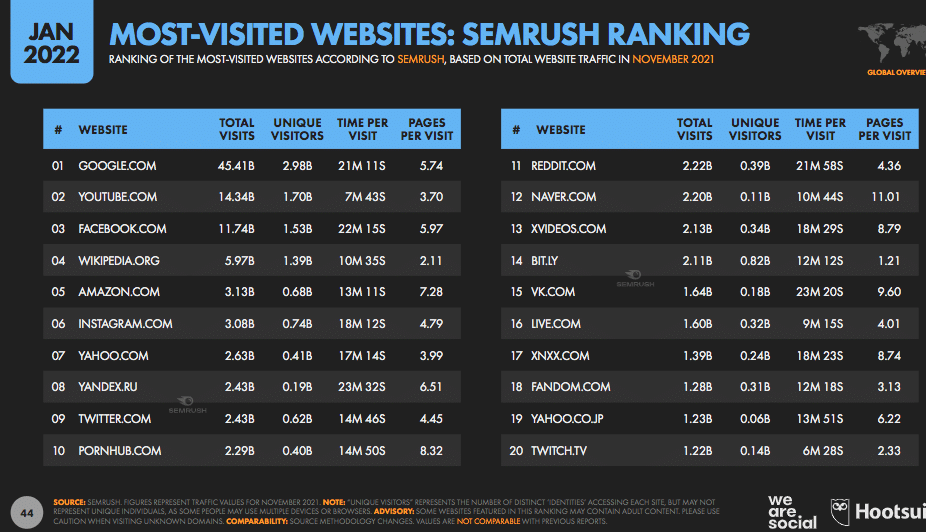
Source: Hootsuite
- The most subscribed channel on YouTube is T-series, with over 255 million subscribers, followed by Mr. Beast. Source: Statista
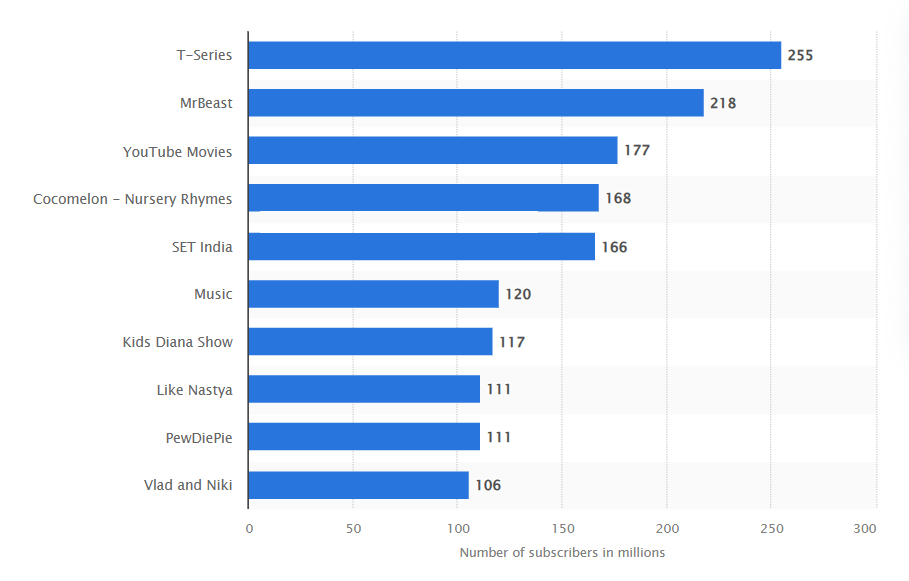
Source: Statista
- X (Twitter) Statistics
- Twitter has the highest number of male users among all the social media platforms, which is 63% of its total users. Source: Statista
- In the US, on average, a Twitter user spent 34 minutes in 2023. It is only after TikTok (53.8 minutes) and YouTube (48.7 minutes). Source: Statista
- The Twitter handle of Elon Musk is the most popular Twitter account, with over 140 million followers. It was followed by Barack Obama’s Twitter handle, which had over 132 million followers. Source: Statista
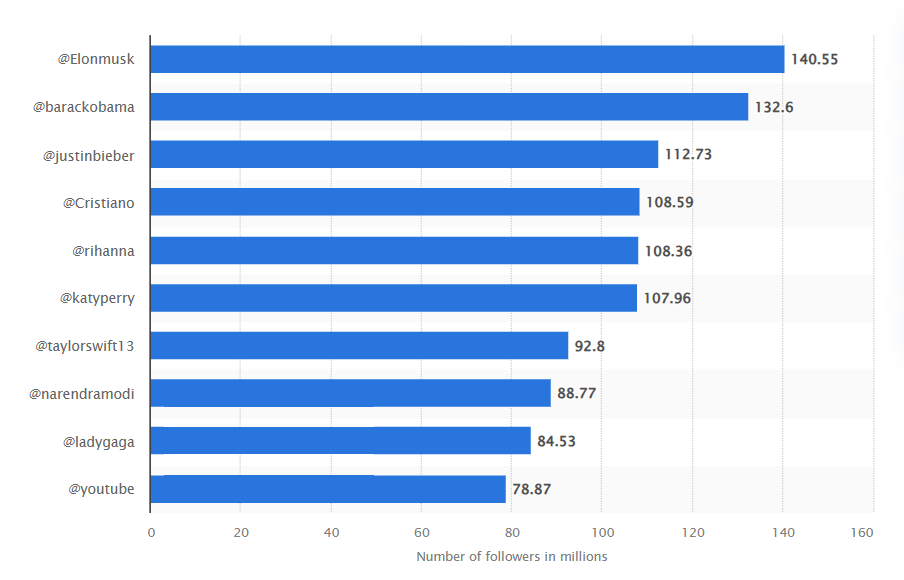
Source: Statista
- Twitter is the 12th most popular social media platform, and more than 600 million active users use it to keep up-to-date with news and current events. Source: Statista
Source: Statista
Social Media Advertising Statistics
- The total potential reach on TikTok is 1.092 billion, which marketers can reach through ads. The actual TikTok ad reach is 13.6% of the total world population. Source: Datareportal
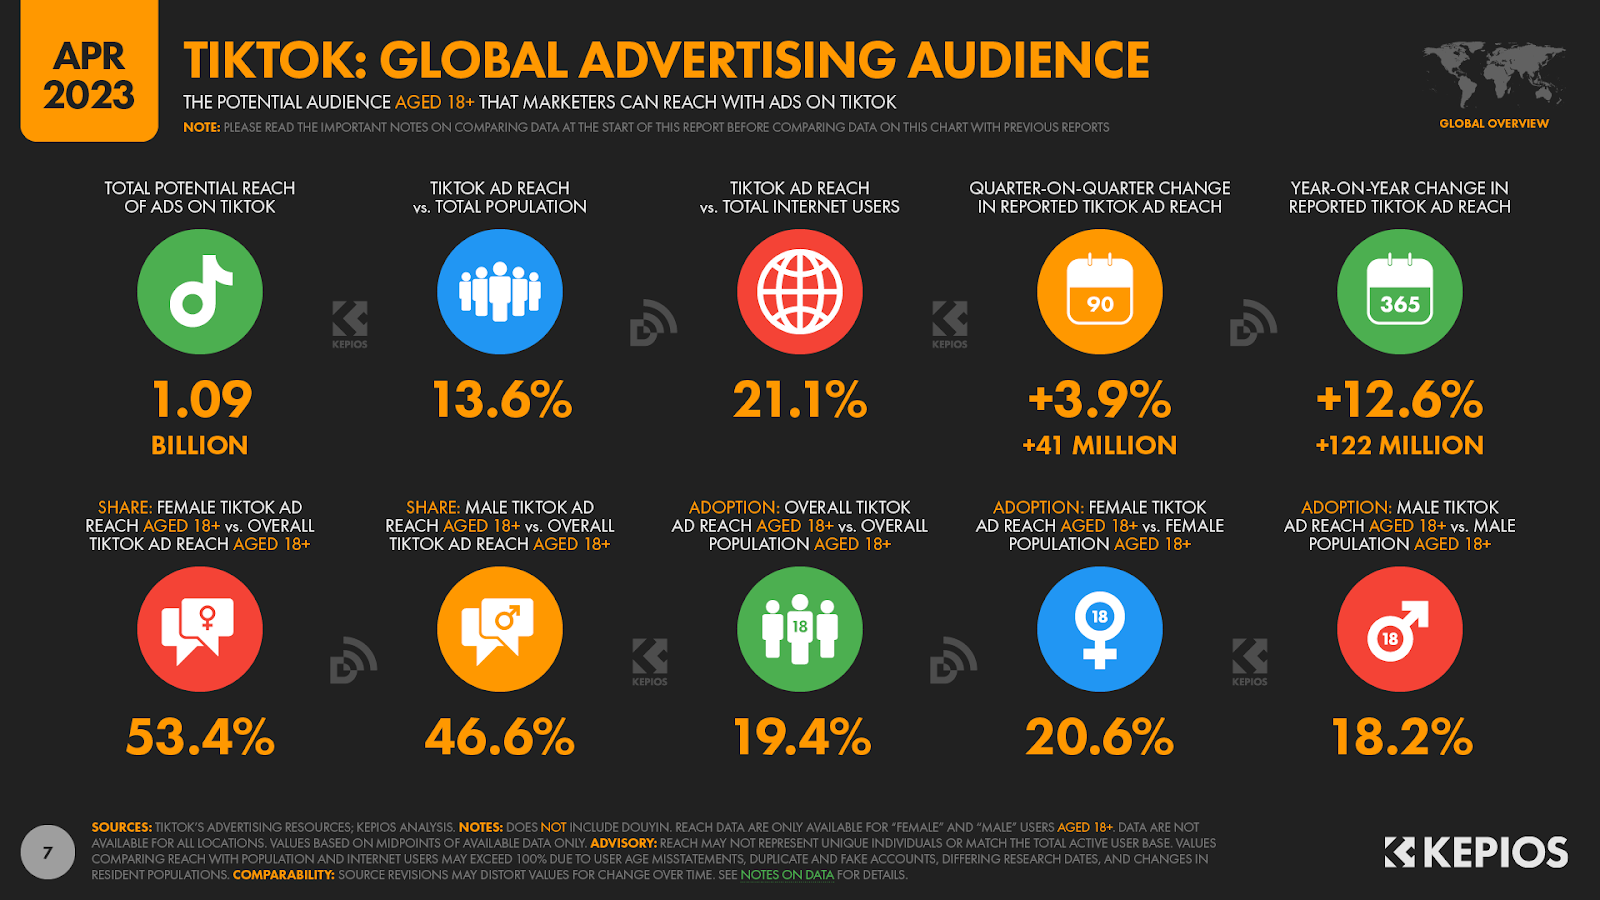
Source: Datareportal
- Of all the advertising spending, more than 65% is spent on social media platforms like Instagram and TikTok. Source: data.ai
- More than 66% of the app economy, roughly 500 billion dollars, is mobile ad spend. Source: data.ai
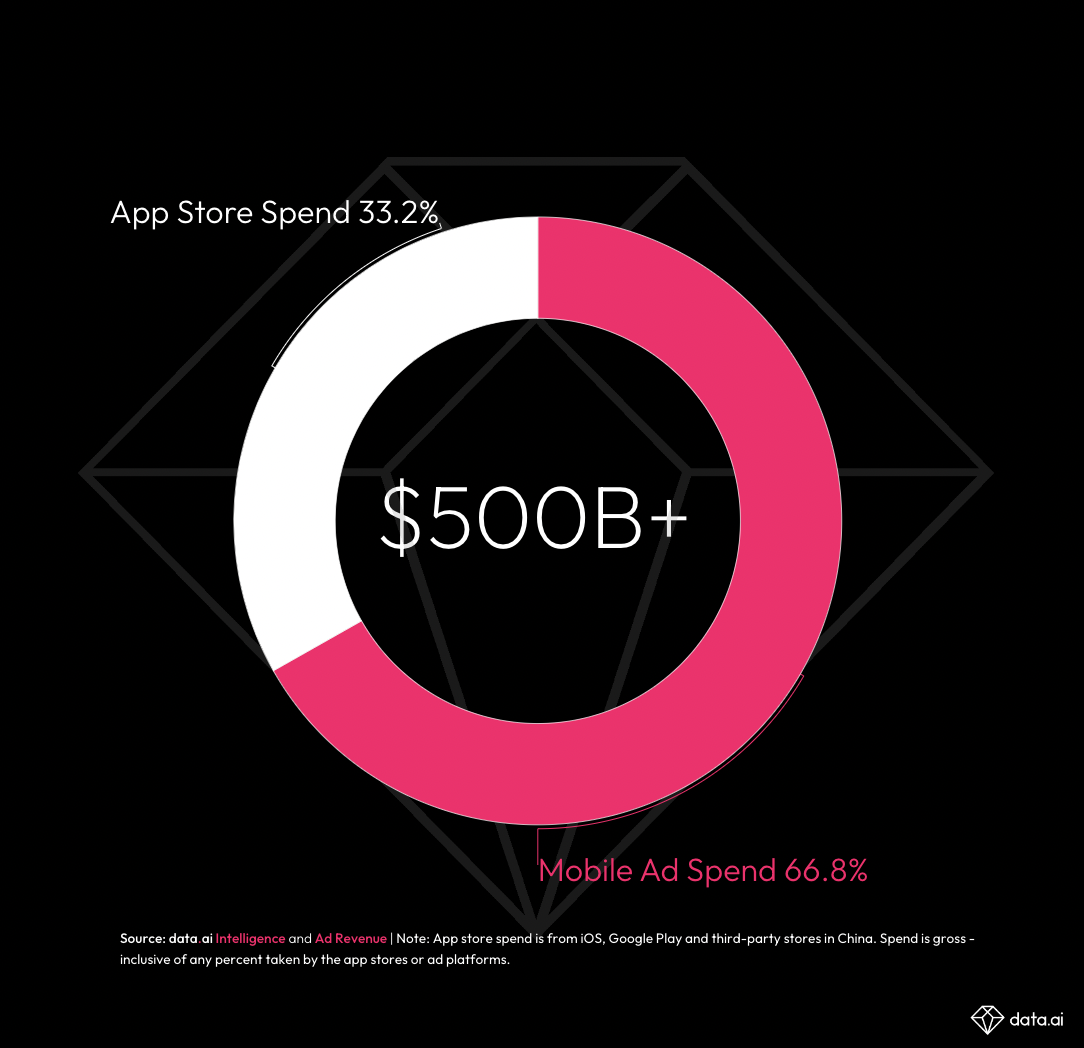
Source: data.ai
- 56% of marketers are planning to increase their TikTok content marketing investment in 2024. Source: Hubspot
- Facebook and Instagram, together, make up the highest ROI among all the social media platforms. Source: Hubspot
- The potential ad reach on Facebook is 27.2% of the total population, which is almost 2.17 billion people. Source: Datareportal
Social Media Video Statistics
- In 2023, 91% of businesses leveraged social media videos as their marketing tool. The percentage was just 61% in 2016. Source: Wyzowl
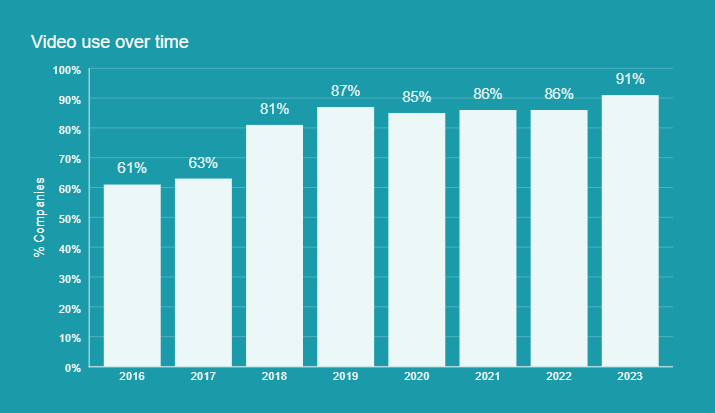
Source: Wyzowl
- 17% of marketers used video as a marketing tool for the first time in 2022. Source: Wyzowl
- Almost 60% of video marketers spend less than $1,000 on an average video. 4% of video marketers even spend $20,000 or more on an average video. Source: Wyzowl
- Short videos are the most used social media format by content marketers. Source: Hubspot
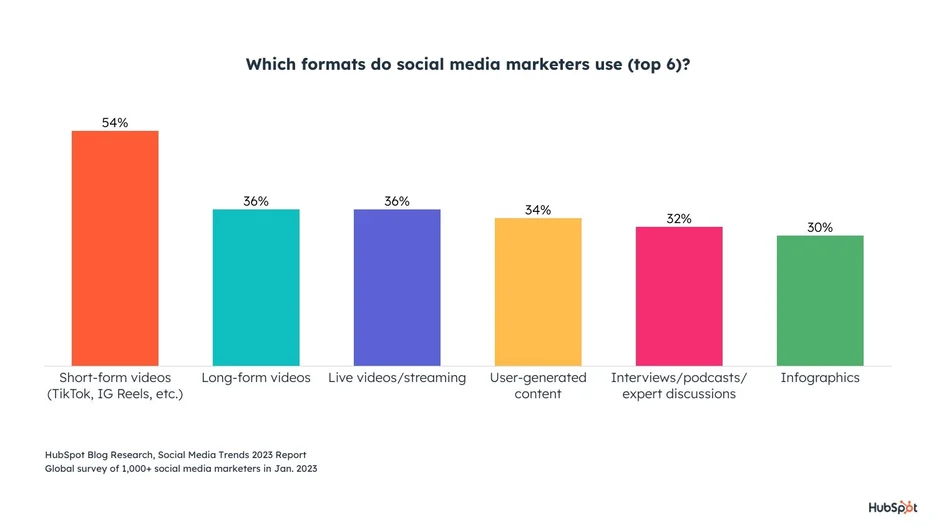
Source: Hubspot
- YouTube remains the most widely used social media platform for videos, with a whopping 90% of marketers using it for video marketing. YouTube is followed by Facebook (86%) and Instagram (79%). Source: Wyzowl
Key Takeaways
With every business trying to leverage social media to the maximum, it is important to understand and choose the correct social media platform for your business needs. Up-to-date data and its strategic use are the best ways to maximize your social media efforts.
