Online business is set for big growth and changes. E-commerce, which used to be just starting, is now a vital part of global commerce, changing how we buy, sell, and connect with people worldwide over various products and services. So, knowing the E-commerce statistics is the need of the hour for any online business.
In this blog, we will break down the e-commerce trends that matter. We see how more people shop and what new technology is making online shopping experiences better. Let’s get started.
Top E-Commerce Statistics
- Retail e-commerce sales are expected to increase rapidly, from approximately 925 billion US dollars in 2023 to over 1.4 trillion US dollars in 2027. Source: Statista
- In the US, about 43% of consumers stated they would rather shop online than in-person. Source: Statista
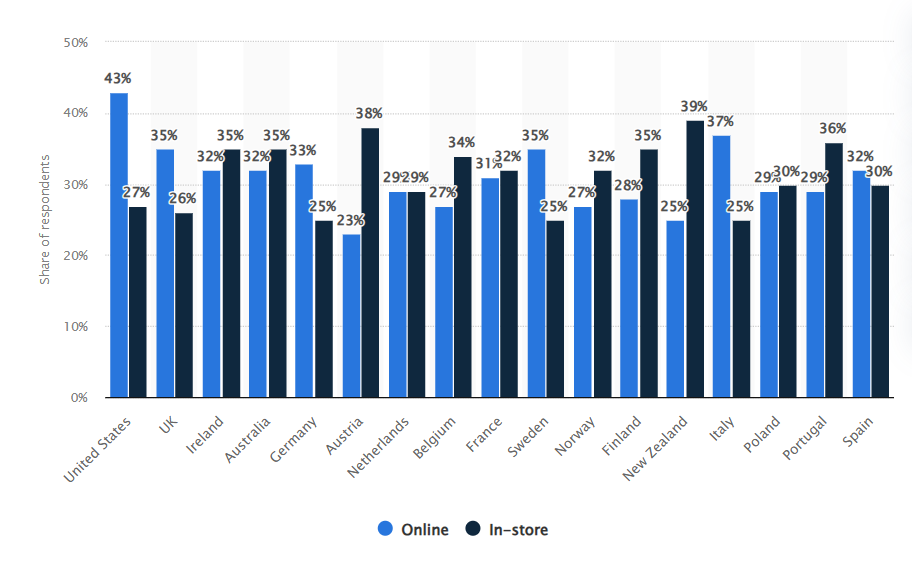
Source: Statista
- Before making a purchase, 83% of global shoppers among all age groups visit two or more websites. Source: DigitalCommerce360
- Apparel, electronics, and footwear are the top 3 products that people buy online in the majority of countries. Source: Dodropshipping
- 15% of subscribers say they prefer to shop online because they have more control over timing. Source: PYMNTS
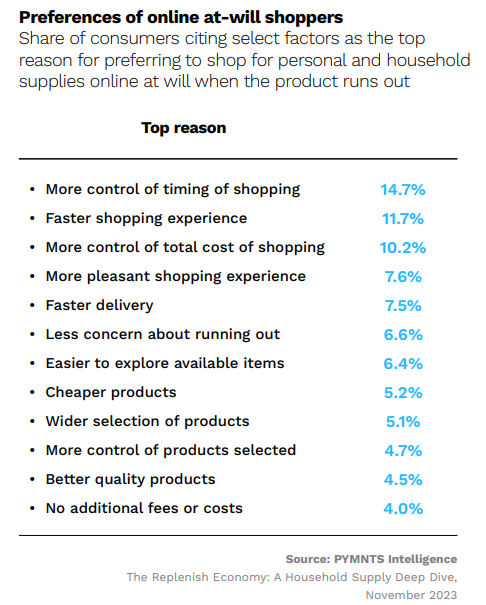
Source: PYMNTS
- When an order is delivered, 45% of customers want to be notified by the retailer. Source: GoShippo
E-Commerce Platform Statistics
- 56% of online consumers have purchased something after reading a blog. Source: Hubspot
- By 2040, 95% of purchases will be made through eCommerce sites. Source: Nasdaq
- In Germany (45%), France (47%), and the United States (51%), Amazon is the most popular shopping destination for consumers. Source: DigitalCommerce360
- In India, there will probably be 378 million digital consumers by 2025. Source: Statista
- The eCommerce industry has grown by almost 23% over the year, though 46% of American small businesses don’t own a website. Source: Shopwhereilive
- 53% of online transactions are made using credit cards, where digital payment systems are (43%), and debit card payment modes are (38%). Source: Kinsta
- Personalization accounts for 40% more revenue for businesses with faster growth rates. Source: McKinsey
Social Commerce Statistics
- Sixty-three percent of individuals aged 18 to 25 reported that they were influenced to buy a product after viewing a brand’s social media promotion. Source: DigitalCommerce360
- Online stores with a social media presence are more likely to draw 32% more sales compared to those that do not have one. Source: Digitalmediateam
- Four out of ten consumers say they are using social media more to find new brands and products. Source: Marketingcharts
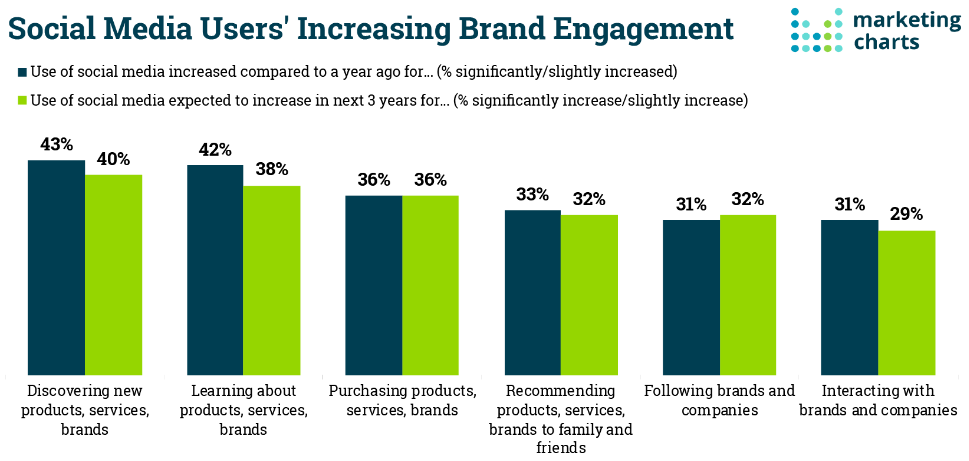
Source: Marketingcharts
- 82% of buyers are more likely to purchase goods that social media influencers recommend. Source: GRIN
- With over 250 million active stores worldwide, Facebook Shops reported a monthly average of one million global users. Source: Statista
- 95% of online buyers made purchases on Instagram or Facebook. Source: GRIN
- Thirty-five percent of American consumers claimed that social media advertisements had an impact on their decisions to buy. Source: Statista
- 58.4% of online shoppers make at least one purchase every week. Source: DataReportal
Mobile Commerce Statistics
- More than 70% of retail website visits worldwide in 2023 came from smartphones, producing more online orders than desktop and tablet computers. Source: Statista
- In 2023, mobile eCommerce’s worth will have already reached $2.2 trillion. Source: Statista
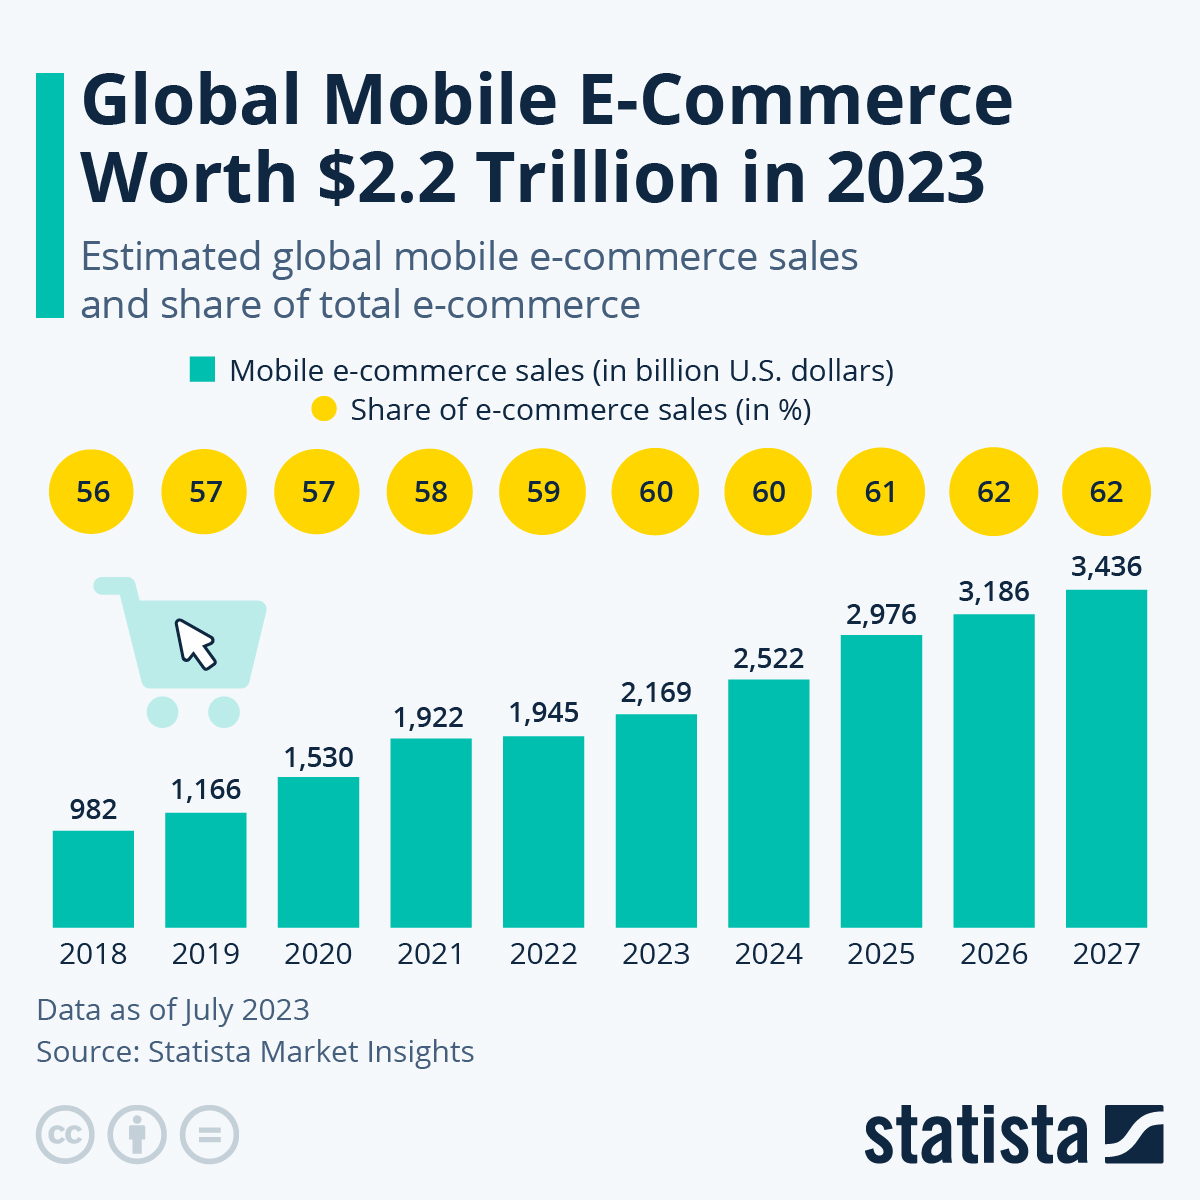
Source: Statista
- 80% of consumers looked up product reviews, compared prices, or located alternate stores using their phones while they were in a physical store. Source: Outerboxdesign
- 87% of American consumers between the ages of 18 and 29 report making an online purchase using a smartphone. Source: Statista
- Globally, the average eCommerce conversion rate is 2.27 percent. Source: IRP
- Online companies have a greater chance of generating a 45% increase in clicks when they use the CTA button. Source: CopyBlogger
- By 2025, voice assistant purchases on smart home devices are projected to have a global transaction value of 164 billion dollars. Source: Statista
E-Commerce Marketing Statistics
- Through affiliate marketing, merchants have seen an average of 23% in revenues. Source: Getlasso
- Research shows that 26% of traffic comes from Google AdWords, and 43% of e-commerce traffic comes from organic Google searches. Source: Trailblaze
- 65% of search traffic is generated from the total e-commerce sessions. An additional 33% is through organic search, and another 32% is through paid search. Source: Hubspot
- 62.7% of internet users use social media (Instagram) to research brands and products. Source: Datareportal
- Consumers prefer to spend 38% more when they receive a personalized shopping experience. Source: Segment
Email E-Commerce Statistics
- Sixty-eight percent of consumers would rather receive personalized emails from brands. Source: Statista
- Email marketing is a customer outreach strategy used by 64.1% of small enterprises. Source: Campaignmonitor
- Emails that were sent out in response to cart abandonment had a 20% read rate at the same time. Source: Statista
- Through segmented campaigns, marketers have observed a 760% increase in email revenue. Source: Campaignmonitor
- Transactional emails usually get an 80-85% average open rate, which is higher than the open rate of other email campaigns. Source: Mailgun
- For welcome messages, e-commerce companies saw a click-to-conversion rate of around 56.8%. Source: Statista
- 60% of consumers claimed that they made purchases because of the email marketing campaign message. Source: Tutorialspoint
Shopping Cart E-Commerce Statistics
- The average cart abandonment rate as of July 11, 2023, is 70.19%. Source: BaymardInstitute
- Emails sent in response to automated cart abandonment were recorded at 44.4 percent. Source: Statista
- When making an online purchase, 45% of consumers stated that the most important factor to them is free return shipping. Source: GoShippo
- Exit-intent popups have helped businesses recover 53% of their abandoned visitors. Source: Optionmonster
- In the last three months, 47.8% of American internet shoppers abandoned carts due to the reason “I was just browsing / not ready to buy.” Source: BaymardInstitute
- Data shows that 25% of people left a cart instantly without purchasing if they needed to open an account during checkout. Source: BaymardInstitute
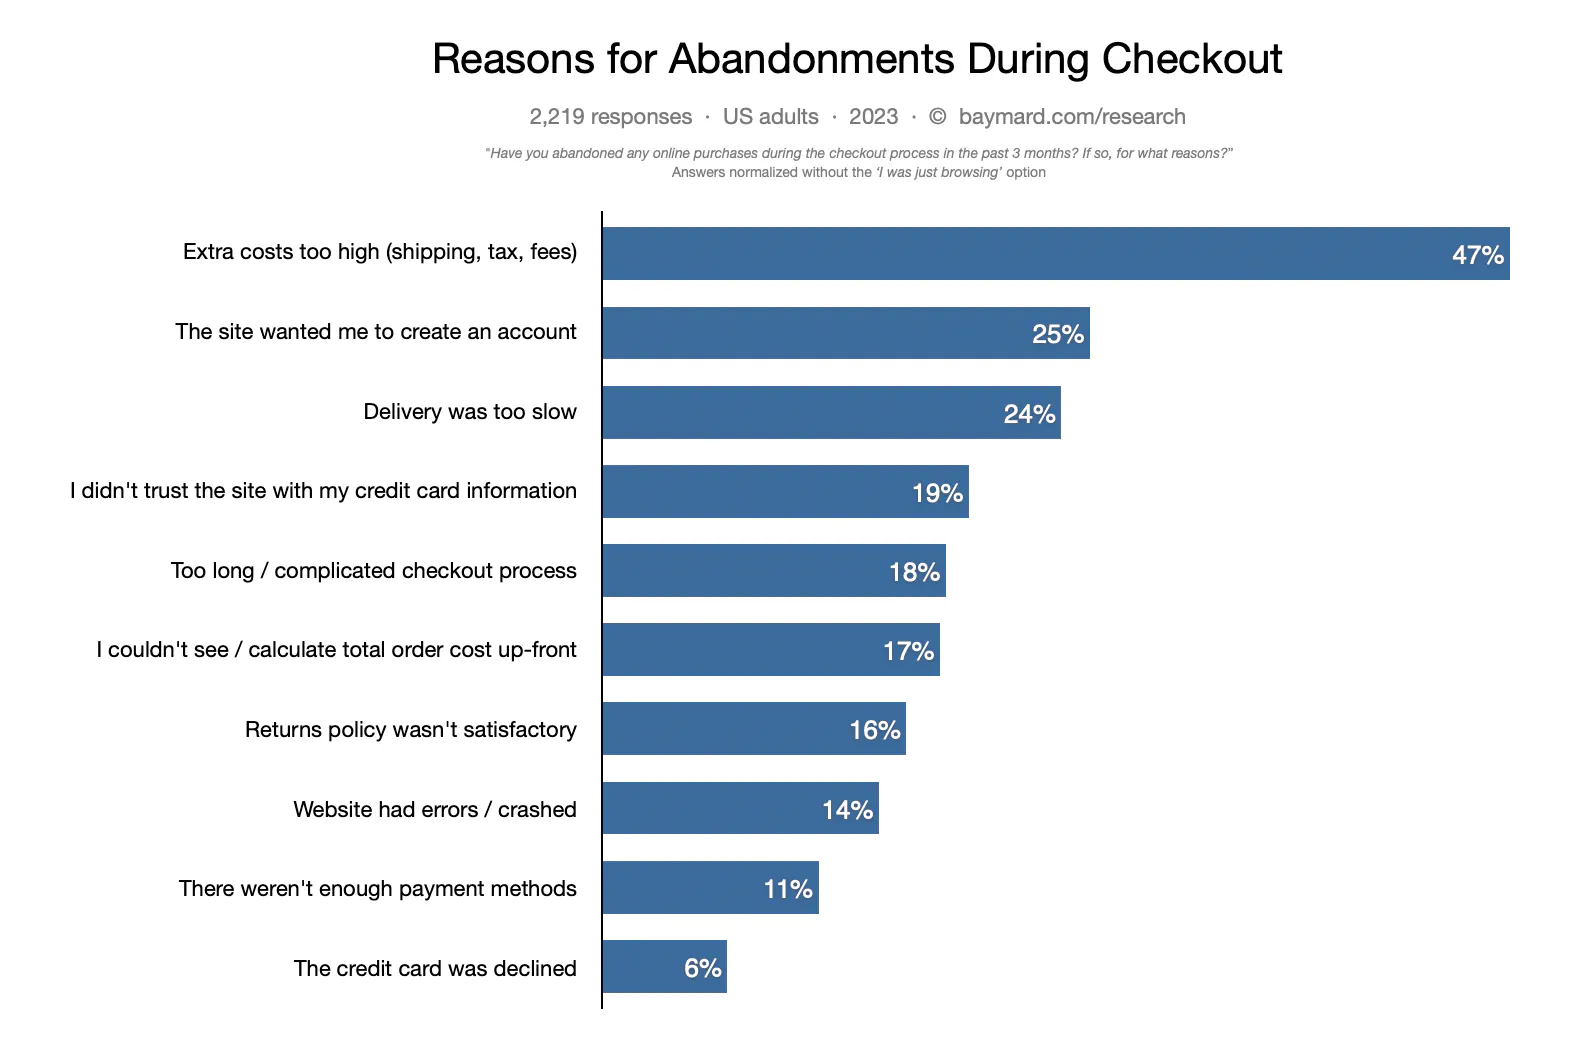
Source: BaymardInstitute
- Clothes have the highest abandonment rate of any product, with a high percentage of 40%. Then, tech comes in at 18%, and next are home products at 16%. Source: Contentsquare
- eCommerce sites can witness a 35.26% increase in conversion rates with an optimized and excellent checkout design. Source: BaymardInstitute
- Websites that provided services for cruise and ferry travel had the highest cart abandonment rates of 98%. Source: Statista
- Because of the average abandonment rate of 68%, eCommerce sites are facing a loss of $3 billion every year. Source: DisruptiveAdvertising
- Cart abandonment was most common among mobile shoppers, with a rate of 93%. Source: Statista
- The biggest reason for the shopping cart abandonment is the huge additional costs. Source: BaymardInstitute
Key Takeaways
As we review these e-commerce trends and statistics for 2024, it’s clear that the sector is undergoing an unprecedented transformation. The key takeaway for businesses is to embrace this change, leveraging data-driven strategies to tap into new opportunities and meet evolving consumer demands.
